Ground Monitoring
Vegetation Monitoring
ACP’s ground monitoring is done for both vegetation and herbivores. The surveys are conducted every 4 to 6 weeks.
Herb-layer biomass, greenness and grazing intensity
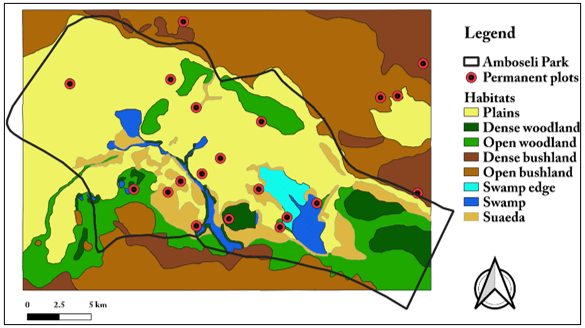
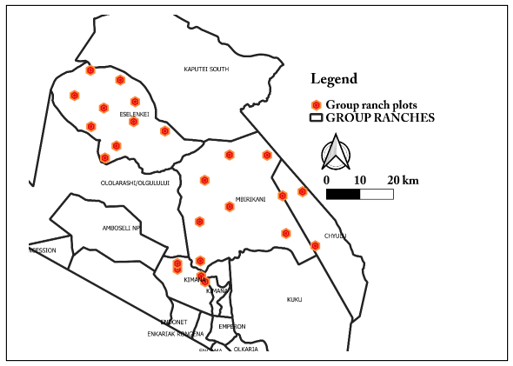
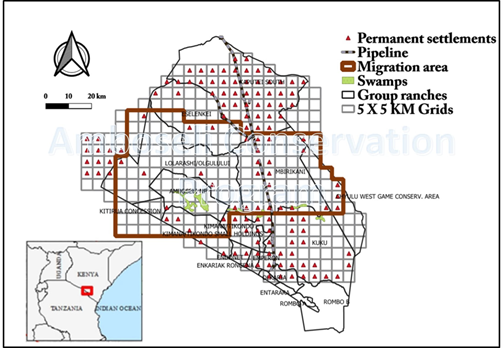
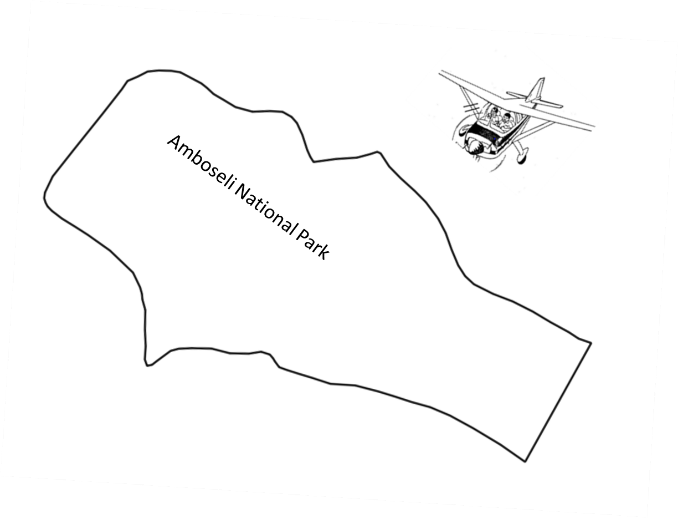
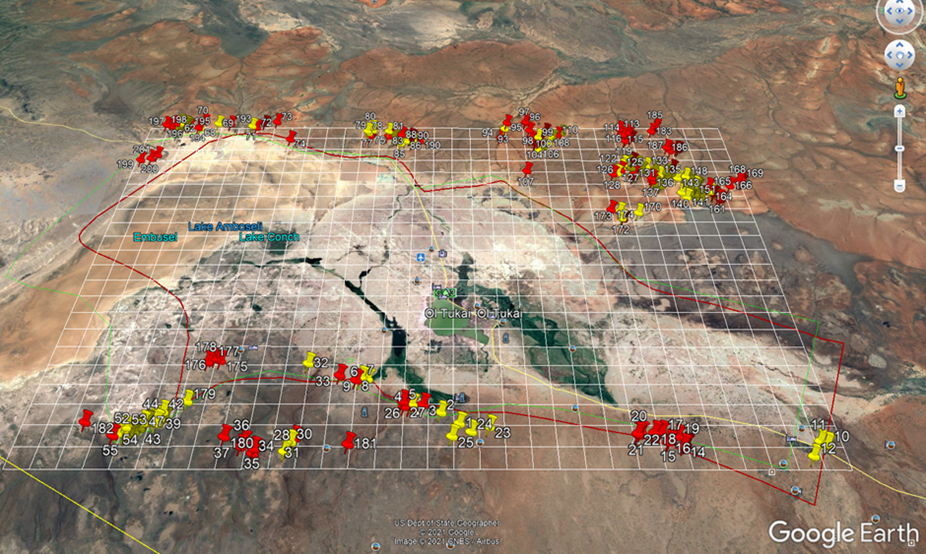
The monthly ground monitoring of the vegetation is conducted both in the plots shown in the basin area (Figure 2) and in the group ranches image on (Figure 3).
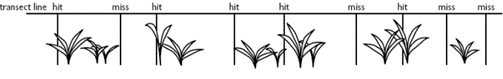
The monitoring that started in 1975 is conducted in each plot, where vegetation cover is measured using the point intercept method (5) . For each frame, ten pins are dropped through a slanting pin frame at an angle of 67°, and each plant hit recorded on a predesigned capture form, onto a digital tablet using open data kit (ODK).
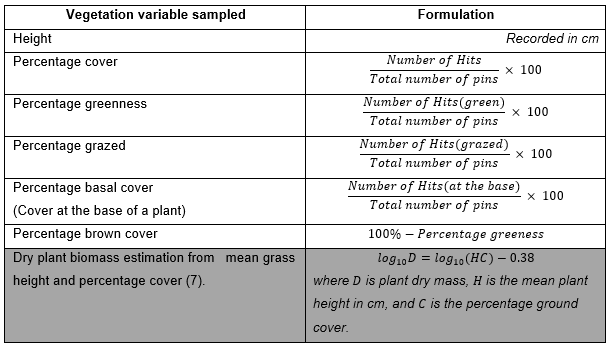
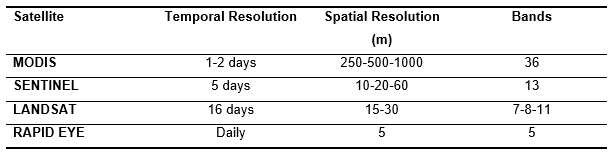
The data is the then transmitted via a cloud network and downloaded onto the ACP’s integrated database (Figure 5) for storage and subsequent analysis. Plant cover is estimated as a percentage of total hits over the total number of pins(6). Grass height is recorded in centimeters. Percentage grazing pressure is estimated from the proportion of grazed and non-grazed hits (Table 1).
Sampling is done in collaboration with the Kenya Wildlife Service (KWS) in Amboseli. No endangered plant species are involved. The plots in (Figure 2) were drawn from an initial sample of 101 randomized plots at the start of the monitoring (See supplementary section).
Species composition
Species composition of all plants that include bush and tree cover sampling that began in 1977 is done once or more a year during the rains, using the point intercept and exclusion quadrant sampling methods(8). See supplementary section for more details.
Plot Level Herbivore Monitoring
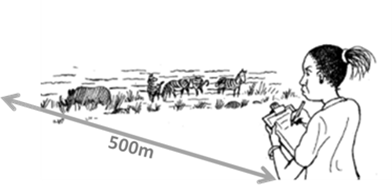
Counts over a 500m radius are made of all animal species from the center of the plots in the basin and surrounding group ranches.
This exercise is done simultaneously with the vegetation sampling hence providing a basis for comparing herbivore and plant relations. The distance from the center of the plot is estimated using a range finder.
Notes on the activity of the animal such as grazing, walking or resting are also taken. Once the data is logged onto the ODK tablet, it is then transmitted from the field to the ACP database.
Additional eighty plots have been included recently for intensive herbivore counting done twice or three times a year. (See supplementary section for the list of species included in the surveys).
Herbivore Body Condition Scores
Livestock and wildlife (zebra, wildebeest and buffalo) body condition scores (BCS) are observed during the ground herbivore monitoring and recorded following the photographic scale shown below (Figure 8).
Amboseli Conservation Program has been tracking range-land conditions in the Amboseli region since 1976. The tracking measures plant biomass, greenness and grazing pressure in 20 permanent plots each month in the 700 square kilometer area in and around the Amboseli Basin used heavily by livestock and wildlife in the dry season. The methods used and the results of the long-term monitoring have been published in (Western et al., 2015)
We have now developed a simplified method of graphically presenting the range-land tracking data to provide group ranch and grazing committees an early warning system indicating the severity of pasture shortage for each year and month. The method uses grazing pressure on a scale of 0 to 100 as a measure of pasture availability.
Zero grazing occurs after good rains and low grazing pressure. To simply the index we use an arrow to indicate the severity of pasture conditions. The arrow in the green range indicates less than a third of the pasture has been grazed down, amber up to two thirds and red severely grazed.
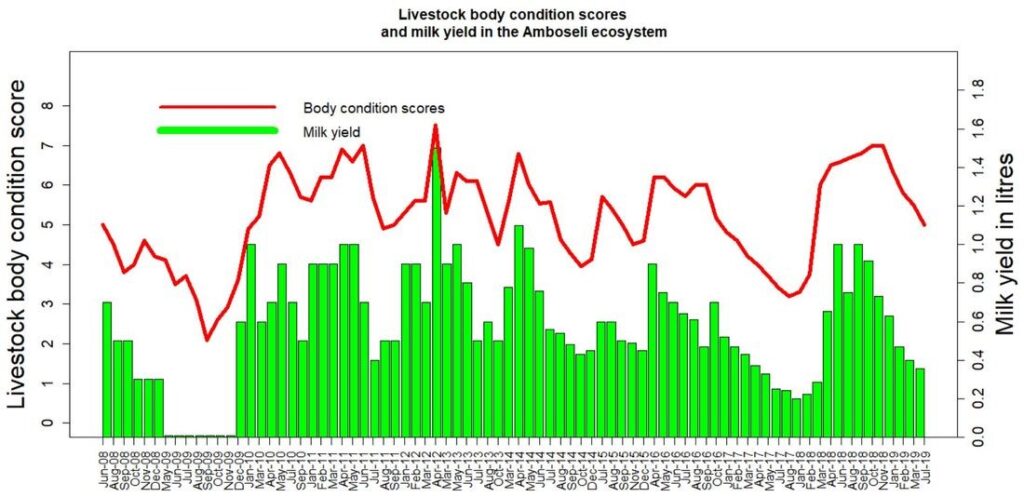
We will be developing and posting tracking details on livestock body condition, milk yields and market prices over the coming month to improve ACP’s range-land monitoring and projections of the seasonal outlook.
Illustration 3 gives a preview of livestock condition and milk production adding weight to the severe outlook for the 2019 long dry season and an early warning of the need for early action to prevent heavy economic losses.(Figure 9)
Ground Monitoring
Vegetation Monitoring
ACP’s ground monitoring is done for both vegetation and herbivores. The surveys are conducted every 4 to 6 weeks.
Herb-layer biomass, greenness and grazing intensity
The monthly ground monitoring of the vegetation is conducted both in the plots shown in the basin area (Figure 2) and in the group ranches image on (Figure 3).
The monitoring that started in 1975 is conducted in each plot, where vegetation cover is measured using the point intercept method (5) . For each frame, ten pins are dropped through a slanting pin frame at an angle of 67°, and each plant hit recorded on a predesigned capture form, onto a digital tablet using open data kit (ODK).
The data is the then transmitted via a cloud network and downloaded onto the ACP’s integrated database (Figure 5) for storage and subsequent analysis. Plant cover is estimated as a percentage of total hits over the total number of pins(6). Grass height is recorded in centimeters. Percentage grazing pressure is estimated from the proportion of grazed and non-grazed hits (Table 1).
Sampling is done in collaboration with the Kenya Wildlife Service (KWS) in Amboseli. No endangered plant species are involved. The plots in (Figure 2) were drawn from an initial sample of 101 randomized plots at the start of the monitoring (See supplementary section).
Species composition
Species composition of all plants that include bush and tree cover sampling that began in 1977 is done once or more a year during the rains, using the point intercept and exclusion quadrant sampling methods(8). See supplementary section for more details.
Plot Level Herbivore Monitoring
Counts over a 500m radius are made of all animal species from the center of the plots in the basin and surrounding group ranches.
This exercise is done simultaneously with the vegetation sampling hence providing a basis for comparing herbivore and plant relations. The distance from the center of the plot is estimated using a range finder.
Notes on the activity of the animal such as grazing, walking or resting are also taken. Once the data is logged onto the ODK tablet, it is then transmitted from the field to the ACP database.
Additional eighty plots have been included recently for intensive herbivore counting done twice or three times a year. (See supplementary section for the list of species included in the surveys).
Herbivore Body Condition Scores
Livestock and wildlife (zebra, wildebeest and buffalo) body condition scores (BCS) are observed during the ground herbivore monitoring and recorded following the photographic scale shown below (Figure 8).
Amboseli Conservation Program has been tracking range-land conditions in the Amboseli region since 1976. The tracking measures plant biomass, greenness and grazing pressure in 20 permanent plots each month in the 700 square kilometer area in and around the Amboseli Basin used heavily by livestock and wildlife in the dry season. The methods used and the results of the long-term monitoring have been published in (Western et al., 2015)
We have now developed a simplified method of graphically presenting the range-land tracking data to provide group ranch and grazing committees an early warning system indicating the severity of pasture shortage for each year and month. The method uses grazing pressure on a scale of 0 to 100 as a measure of pasture availability.
Zero grazing occurs after good rains and low grazing pressure. To simply the index we use an arrow to indicate the severity of pasture conditions. The arrow in the green range indicates less than a third of the pasture has been grazed down, amber up to two thirds and red severely grazed.
We will be developing and posting tracking details on livestock body condition, milk yields and market prices over the coming month to improve ACP’s range-land monitoring and projections of the seasonal outlook.
Illustration 3 gives a preview of livestock condition and milk production adding weight to the severe outlook for the 2019 long dry season and an early warning of the need for early action to prevent heavy economic losses.(Figure 9)