Aerial Monitoring
The application of open-source tools to biodiversity conservation and natural resource management at the community level has been adopted by ACP. The massive long-term data collected in the Amboseli ecosystem is rapidly analysed and presented using a set of customized open-source tools.
Examples on how these tools support quick community decision making on grazing management and insights on seasonal wildlife distributions and vegetation conditions are available on the online version of this protocol (www.amboselimonitoring.org ) and www.amboseliconservation.org local drought conditions.
The highly interactive tools contain a series of commands that perform various data tasks including: examining the data structure, aggregation, exploratory data analysis, calculation of vegetation biomass (g/m2), percentage grass greenness and grazing pressure estimations, Normalized Difference Vegetation Index (NDVI) extraction, species population estimates and distribution mapping, herbivore social network analysis, machine learning, among other functions. The tools are customized to suit the local community data needs and level of expertise without losing the underlying data richness and integrity.
These tools include interactive and highly animated web interfaces in R -shiny, data collection Apps such as Open Data Kit, visualization and Agent Based Model tools programmed in GAMA among others.
Counting herbivore species and settlements in the Amboseli ecosystem
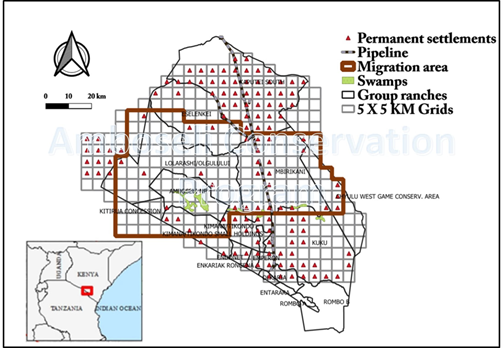
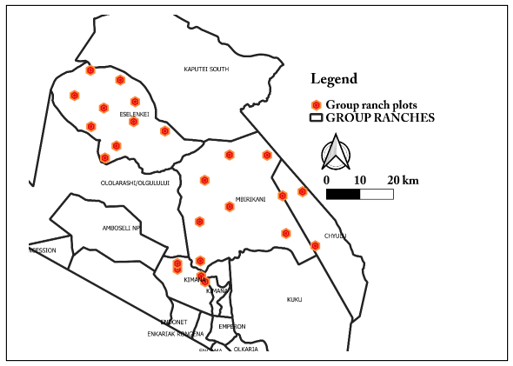
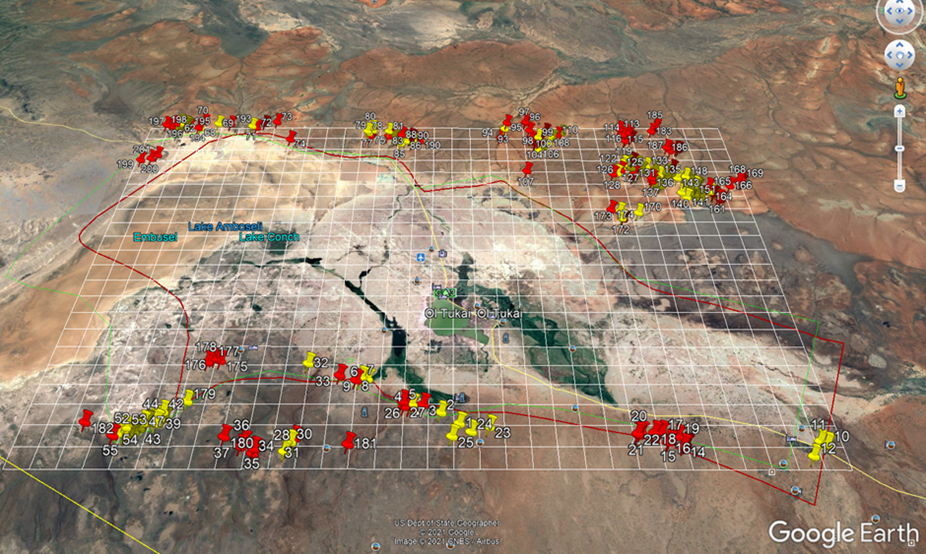
The aerial sample counts of the 8,500 km2 eastern Kajiado county covering the Amboseli ecosystem have been conducted regularly since 1974. The area is divided on a UTM map projection into 5 by 5 km grids (Figure 1). The aerial counts were established in 1973 to cover the migratory range of the Amboseli migrants.
The Amboseli zebra, wildebeest and elephant herds were found to overlap populations on Kaputei Group Ranches to the north, Chyulu Hills and Tsavo West National Park to the east, Kilimanjaro and Ngaserai in Tanzania to the south, and Namanga to the west. The count area was expanded to 8,500 km² over two subsequent counts to encompass the metapopulations. The spatial coverage was continued from 1974 onward despite the land use changes, aimed at capturing the impact of development on pastoralism and wildlife in eastern Kajiado and the Amboseli migratory ecosystem.
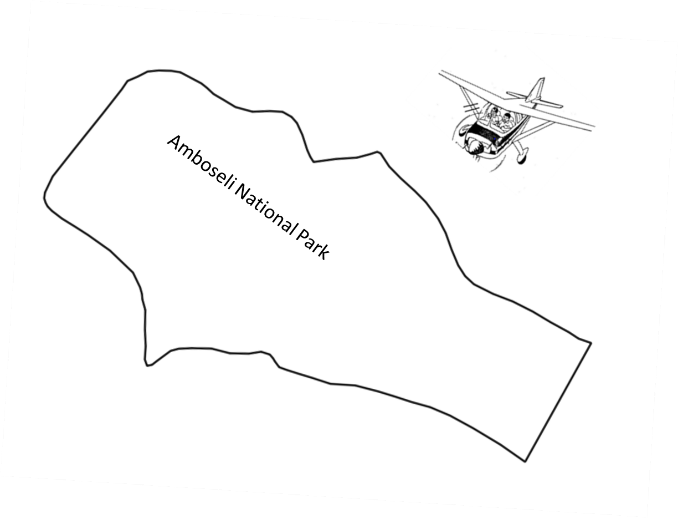
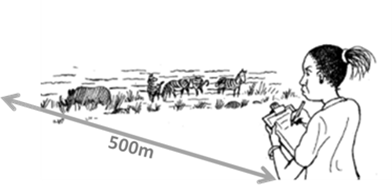
For each survey, a light aircraft, consisting of the pilot, a front seat observer (FSO), and two rear seat observers (RSO) fly at an average of 190 km/h in north–south direction and at a nominal height of 90 m following transects, each separated by a fixed distance of 5 km (Figure 12). Rear-seat observers counted animals that fall within narrow strips of 144 m on either side of the aircraft, defined by rods attached to the wing struts (9).
Herds of both wild and domestic herbivore of 15 or fewer animals are counted directly while those exceeding 15, photographs are taken for corroboration of group size (10). Since the sampling fraction is about 5.6 % of the area for transects separated by 5 km, population estimates within the entire ecosystem are extrapolated from densities estimated within strip transects following the Jolly method 2 (11).
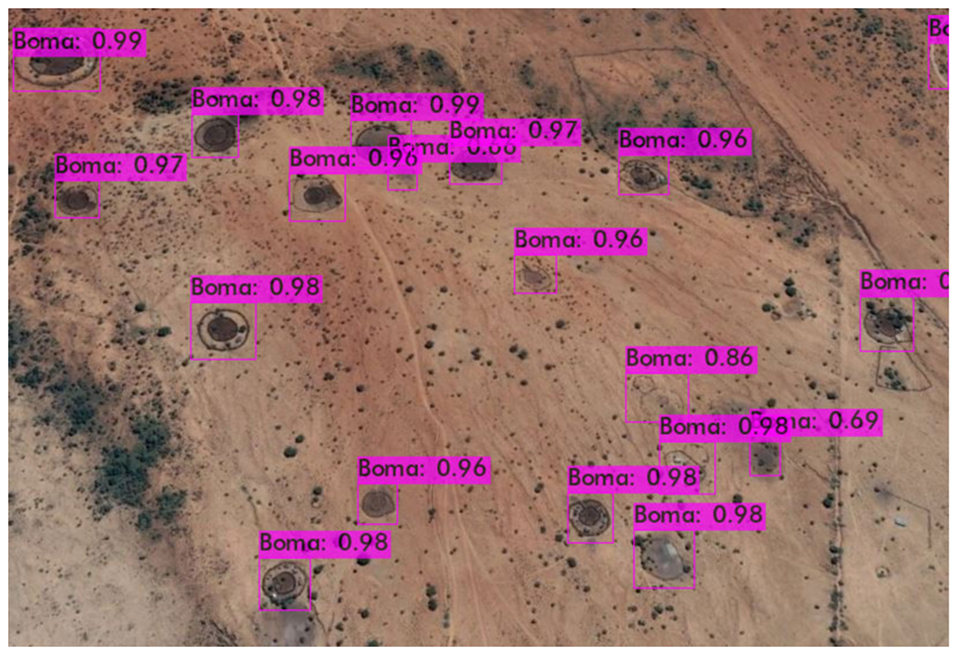
Due to the mixing of sheep and goat herds by Maasai pastoralists, we lump both as “shoats”. Human activity, including livestock corrals, the number and type of huts and presence of farms in a grid, are also scored. The numbers and distribution of livestock corrals and homesteads, rather than human population per se, has been shown to displace wildlife through disturbance and pasture depletion(12). Homes are logged as traditional temporary dung huts (ngajijik), and permanent thatch-roofed or other structures.
Other environmental variables recorded include grass greenness measures on a scale of 0% to 100%. 0% denotes no grass or grass without green material. For roughly uniform grids, the greenness value within grid is assessed by a larger number of spot samples which are subjectively averaged by the observer. In heterogenous swards, each grassland association is ranked, and an integrated value assigned.
Any greenness representing more than 30% of the 5 x 5 km grid is taken to represent the entire grid as most animals track the green patches (13,14).
Crude estimates of grass cover, height, tree canopy cover and agriculture greenness are done in the same way by the FSO. The spatial location of all observations within a given subunit are assigned to the centre point of the subunit – 5 x 5 km grid.
Aerial Monitoring
The need to balance biodiversity conservation with sustainable development, though widely agreed upon, is elusive in practice. Human societies are increasingly disconnected from the ecosystems which support them.
The loosening connection and growing scientific acceptance that ecosystems are complex, dynamic, non-linear systems pose new challenges for rangeland monitoring. Consequently, although conventional monitoring has contributed to better range practices, a far more integrated and multi-scale approach is required as human activity becomes more pervasive and dominant locally and globally.
Integrated monitoring must track social and economic variables no less than ecosystem services in a reliable and affordable way. In addition, analysis and feedback involving the data collectors and land users should become an integral part of adaptive rangeland management more akin to business approaches than conventional science. As demanding as such an integrated approach may seem, much of the socioeconomic data already exists and physical and biological data can increasingly be collected and collated by new imaging technologies.
For monitoring to be locally and globally useful, it must provide information to local users in a timely and usable form and simultaneously provide data on which deleterious environmental impact can be assessed independently of the users. A set of guiding principles for setting up such programs is discussed.
The utility of monitoring and its guiding principles will only work effectively where good environmental governance is practiced by users and producers affecting rangeland ecosystems.
Counting herbivore species and settlements in the Amboseli ecosystem
The aerial sample counts of the 8,500 km2 eastern Kajiado county covering the Amboseli ecosystem have been conducted regularly since 1974. The area is divided on a UTM map projection into 5 by 5 km grids (Figure 1). The aerial counts were established in 1973 to cover the migratory range of the Amboseli migrants.
The Amboseli zebra, wildebeest and elephant herds were found to overlap populations on Kaputei Group Ranches to the north, Chyulu Hills and Tsavo West National Park to the east, Kilimanjaro and Ngaserai in Tanzania to the south, and Namanga to the west. The count area was expanded to 8,500 km² over two subsequent counts to encompass the metapopulations. The spatial coverage was continued from 1974 onward despite the land use changes, aimed at capturing the impact of development on pastoralism and wildlife in eastern Kajiado and the Amboseli migratory ecosystem.
For each survey, a light aircraft, consisting of the pilot, a front seat observer (FSO), and two rear seat observers (RSO) fly at an average of 190 km/h in north–south direction and at a nominal height of 90 m following transects, each separated by a fixed distance of 5 km (Figure 12). Rear-seat observers counted animals that fall within narrow strips of 144 m on either side of the aircraft, defined by rods attached to the wing struts (9).
Herds of both wild and domestic herbivore of 15 or fewer animals are counted directly while those exceeding 15, photographs are taken for corroboration of group size (10). Since the sampling fraction is about 5.6 % of the area for transects separated by 5 km, population estimates within the entire ecosystem are extrapolated from densities estimated within strip transects following the Jolly method 2 (11).
Due to the mixing of sheep and goat herds by Maasai pastoralists, we lump both as “shoats”. Human activity, including livestock corrals, the number and type of huts and presence of farms in a grid, are also scored. The numbers and distribution of livestock corrals and homesteads, rather than human population per se, has been shown to displace wildlife through disturbance and pasture depletion(12). Homes are logged as traditional temporary dung huts (ngajijik), and permanent thatch-roofed or other structures.
Other environmental variables recorded include grass greenness measures on a scale of 0% to 100%. 0% denotes no grass or grass without green material. For roughly uniform grids, the greenness value within grid is assessed by a larger number of spot samples which are subjectively averaged by the observer. In heterogenous swards, each grassland association is ranked, and an integrated value assigned.
Any greenness representing more than 30% of the 5 x 5 km grid is taken to represent the entire grid as most animals track the green patches (13,14).
Crude estimates of grass cover, height, tree canopy cover and agriculture greenness are done in the same way by the FSO. The spatial location of all observations within a given subunit are assigned to the centre point of the subunit – 5 x 5 km grid.